Data Analytics
Drive innovation and make smarter decisions with cutting-edge data analytics. We help you unlock your data’s full potential, delivering actionable insights that provide a competitive edge in today’s fast-paced, data-driven world. By leveraging advanced techniques and top-tier technologies, we transform diverse data forms, into enterprise-grade intelligence, ensuring accuracy, relevance, and strategic impact.
Our solutions are trusted by the greatest data teams






What to expect?
From data exploration to actionable insights, our solutions combine deep expertise, data science, advanced analytics, and top technologies to help you uncover hidden patterns and build powerful predictive models. We empower you to harness the full potential of your data at every stage of your journey.

Reporting
We build operational reporting suites that are designed to take your organisation to the next level. Our automated, consistent and high quality reporting enables confident decision making.

Data visualisation
Transform complex data sets into intuitive charts, graphs, and dashboards to help everyone across your organisation leverage data to identify trends and make smarter strategic decisions.

Advanced analytics
Statistics, machine learning, and predictive modeling extract valuable insights and patterns from your data, empowering data-driven decisions, opportunity identification, and complex problem-solving.

Exploration
We take your complex business challenges and apply a range of analytical techniques to find the answers that are hidden within your data - providing you with the information you need to make a positive change.
The output?

Minimise data friction
Remove bottlenecks and streamline your analytics processes to help build confidence and trust in your data and reporting. Our solutions are designed to be fully automated and aligned with your organisational ways of working, providing you with the confidence to access, analyse and act on data with confidence. Self-service is key to a well built solution, we remove friction and key person dependencies to deliver the insights you need.

Maximise data adoption
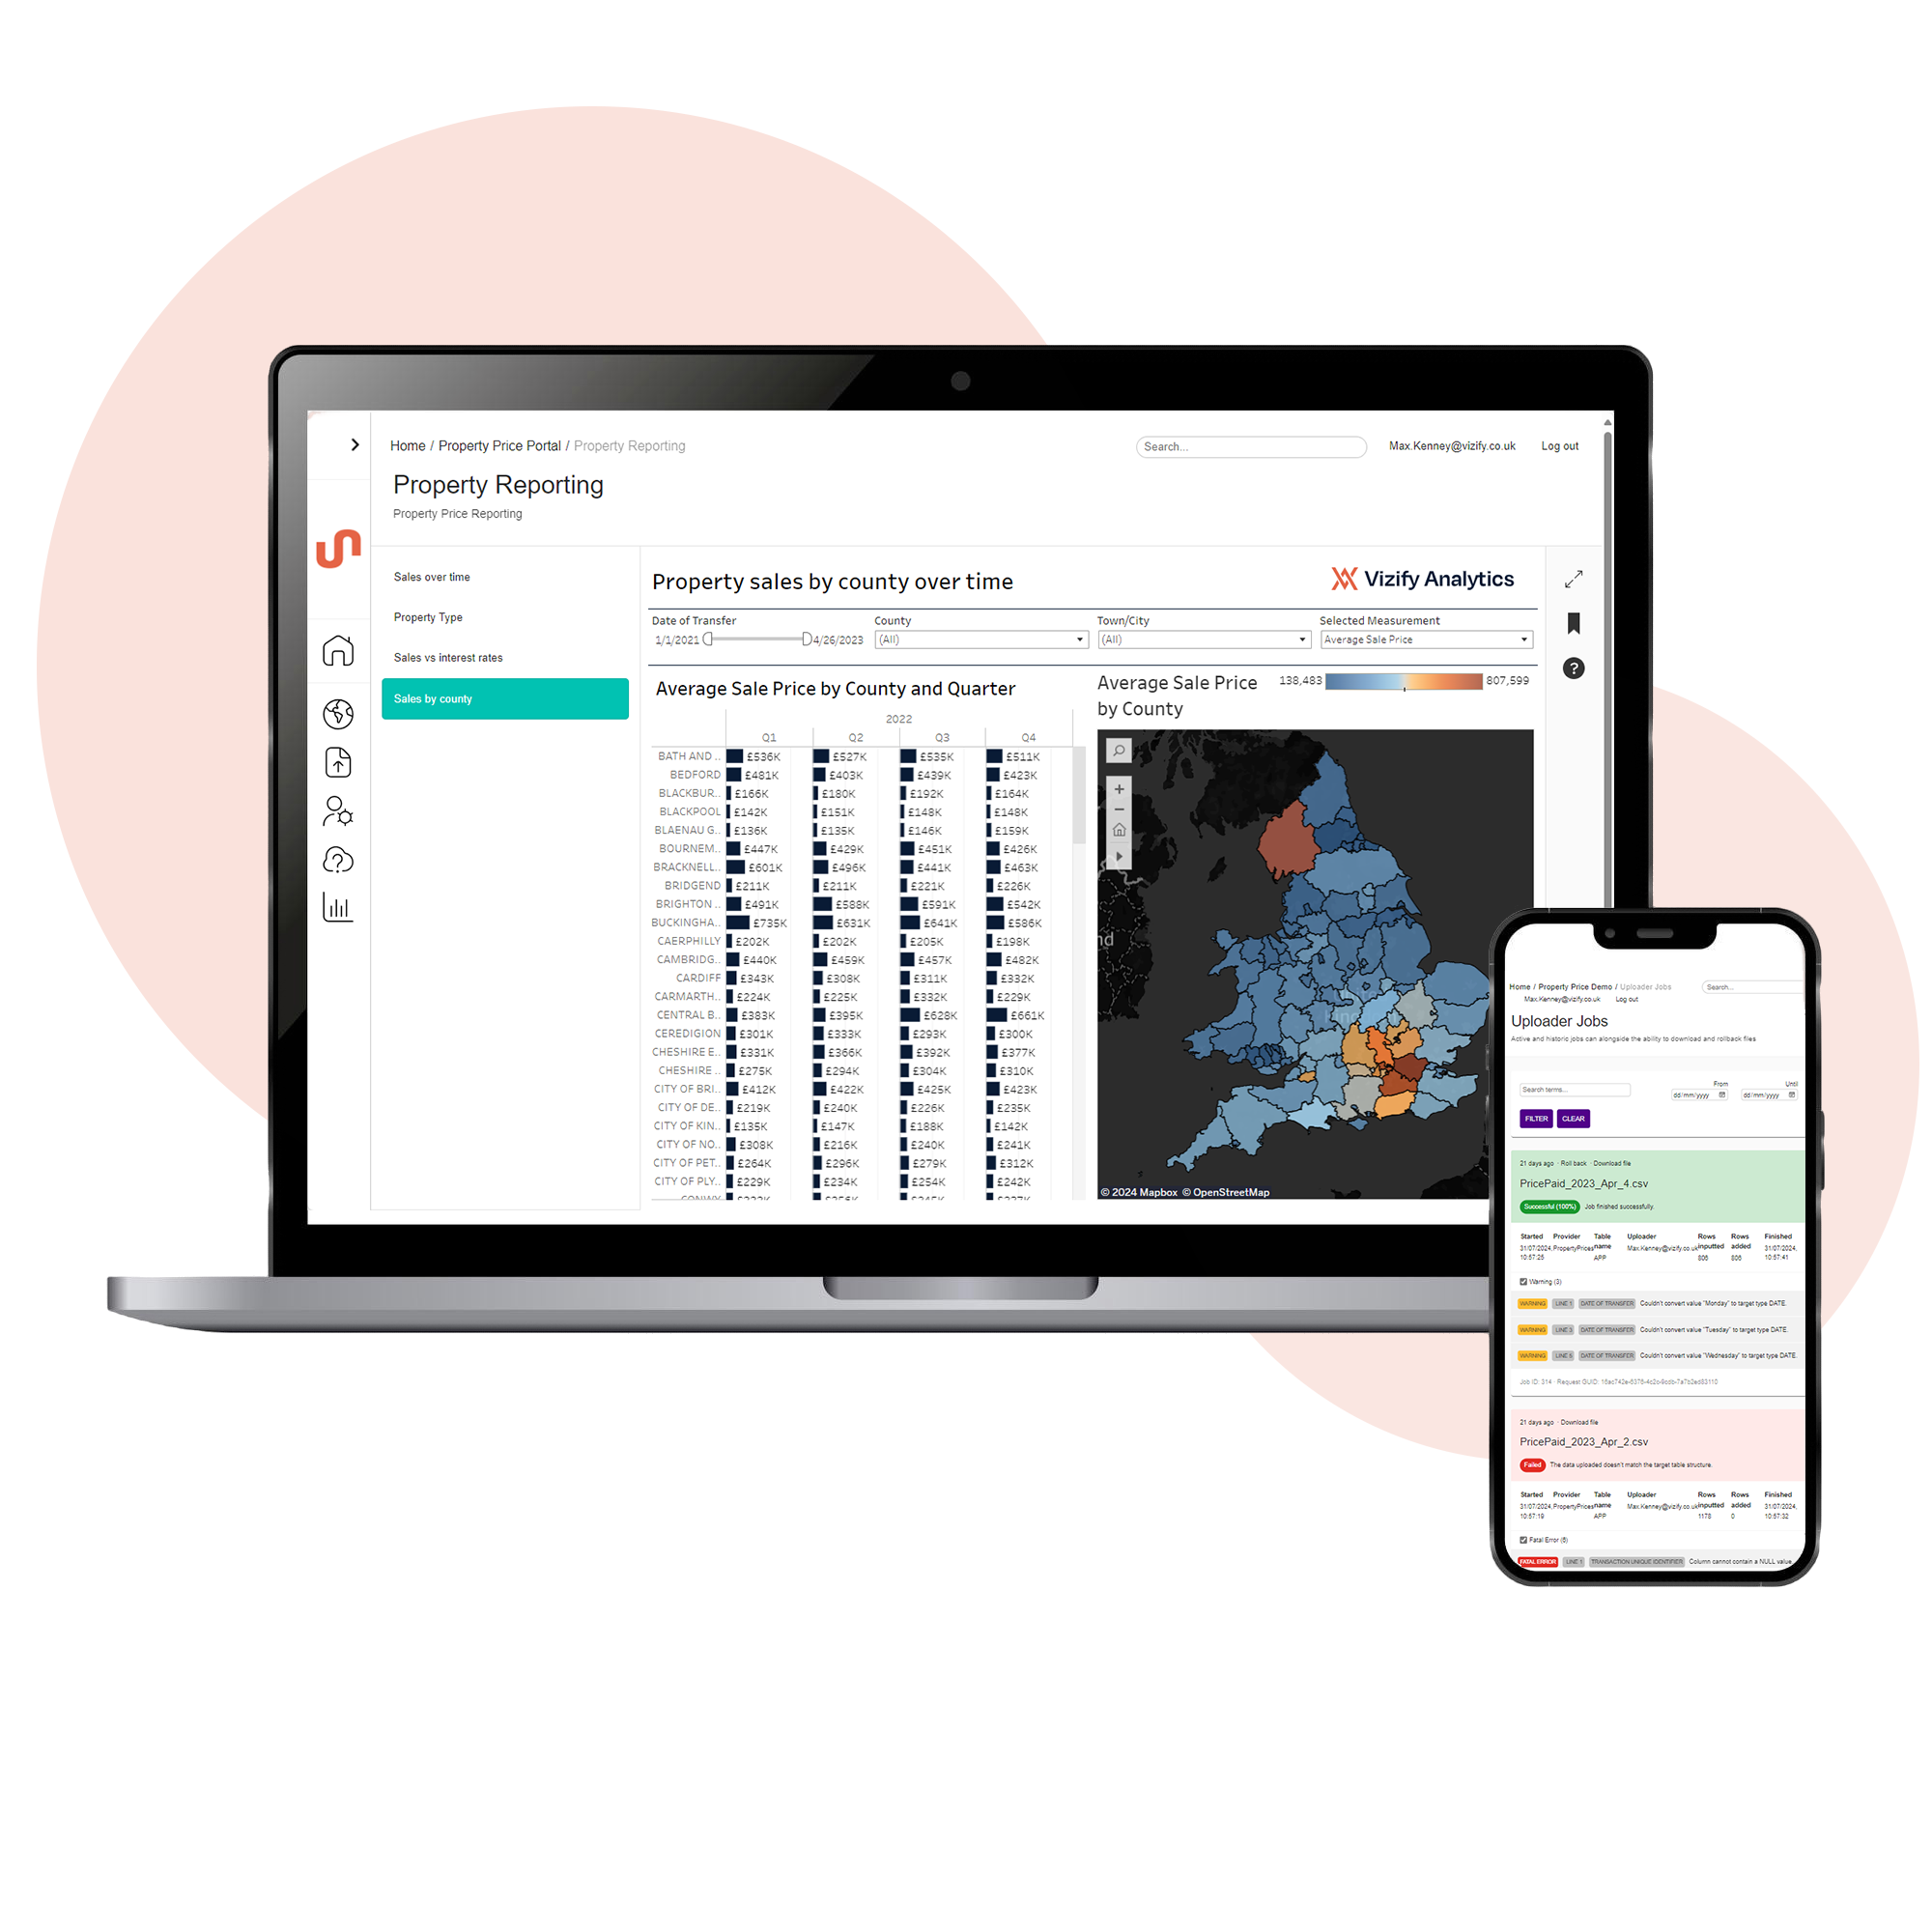
Data visualisation acts as a universal language that fosters effective communication and collaboration. We create clear, visually appealing data representations to facilitate sharing, alignment and understanding of complex information across all teams. Enhance data adoption further with our cloud-based analytics hub, Unify, which centralises your analytics and enables self-service intelligence through a single, intuitive platform.
Unify is our advanced, custom-built analytics hub designed to complement our core analytics services. It serves as a centralised home for your organisation’s analytics, driving adoption, consumption, and change. This easy-to-manage, cloud-based platform integrates multiple analytics tools, essential content, and robust search capabilities, delivering what your teams need, when they need it. Empower self-service, foster collaboration, and achieve analytics excellence with Unify—your fully branded analytics portal.
Six core principles

Accuracy & data quality
Trustworthy data is key. We leverage modern reporting and analytics techniques to ensure your data is clean, accurate, and reliable, forming the foundation for all analytics efforts.

Relevance & business alignment
Every solution is aligned with your business goals, ensuring that the insights delivered directly support your strategic objectives and are fit for use across your organisation.

Best-in-class technologies
We provide expert guidance on the optimal data tech-stack, partnering with top analytics technologies like Tableau and PowerBI. Our custom-built data analytics hub, Unify, allows your teams to self-serve centralised analytics.

Actionable output
Our data analytics doesn’t just analyse—it transforms. We provide insights that lead to clear, data-driven actions, driving business growth and operational improvements.

Scalability & flexibility
Our solutions scale with your business. Whether you're dealing with small datasets or big data environments, and regardless of whether you're using manual processes or established tech stacks, our analytics solutions are designed to adapt and scale according to your evolving needs.

Continuous improvement
Data analytics is not a one-time process. We continuously monitor performance, refine models, and improve methodologies, ensuring sustained value as your business evolves.
Enhance your decision making
By utilising data visualisation, we can help you transform complex data sets into visually intuitive charts, graphs, and dashboards. This empowers your decision-makers to quickly grasp and understand trends, patterns, and correlations in the data. Clear and interactive visualisations enable more informed decision-making, as your people can easily identify insights and trends, leading to better strategic choices and improved outcomes.
Take advantage of actionable insights
We use a variety of data science techniques to help extract valuable insights from large and complex datasets. By leveraging advanced analytics algorithms, we can help you uncover hidden patterns to create powerful predictive models. Let us help you identify actionable insights to drive business growth, improve processes, and optimise resource allocation.
Improve your efficiency and performance
With visualisations crafted by Vizify, we can help you identify bottlenecks, inefficiencies, or areas of underperformance in real-time. We can identify problem areas, perform root cause analysis, and make data-driven recommendations for process optimisation or performance enhancement. Working with Vizify enhances efficiency, productivity, and operational excellence.
Enjoy effective communication and collaboration
Data visualisation acts as a common language that facilitates effective communication and collaboration among different teams and stakeholders. We create clear and visually appealing representations of data to make it easier for non-technical individuals to understand and interpret complex information. When insights are clearly identified and presented through data visualisations, it becomes easier for teams to align their efforts, share knowledge, and collaborate towards achieving common goals.


